
From credible data to leading strategy – innovative examples of strategic sustainability reporting
- Post Date
- 16 February 2023
- Read Time
- 5 minutes

In our accompanying article, we describe how companies can move beyond a compliance-led approach, to craft sustainability reporting that sets their business strategy firmly within its sustainability context.
This idea may not sound new. After all, the <IR> Framework will be ten years old this year, and many companies now include more than a nod to sustainability or ESG within their annual financial and strategic reports.
Yet for many companies, there is still a gulf between how they frame their business strategy and how they describe their sustainability goals. And as we describe in the article, with the move toward more regulated ESG reporting, there is a risk that companies will tend toward generic, compliance-driven statements in their reporting, rather than fully setting out their long-term strategy in light of material risks and opportunities.
So which are the companies that buck this trend, by more fully describing the “big picture” of how their business strategy and sustainability challenges and opportunities intersect? The following list isn’t exhaustive, but contains some examples that we feel set their reporters apart from the pack.
Creating value – Novartis and Ford
The <IR> Framework, now merged into the International Sustainability Standards Board (ISSB), remains a leading resource for companies looking to integrate sustainability context into financial reporting. The framework is flexible, and many companies pick and choose from its recommendations in building their reports. A key concept is that of value creation, helping companies to think through and report on the channels through which they create, preserve or erode value over time.
Ford (Fig 1) does an effective job of visualising its value creation approach, describing the enabling “capitals”– from its $50bn commitment to investment in electric vehicles, to its energy and water consumption – through which it creates value for stakeholders. Novartis uses a “pipeline” illustration (Fig 2) to demonstrate a similar concept, focusing on how it embeds innovation and access in its business strategy. Novartis’ reporting on risk also stands out, integrating and prioritising sustainability risks alongside other key business risks (Fig 3).
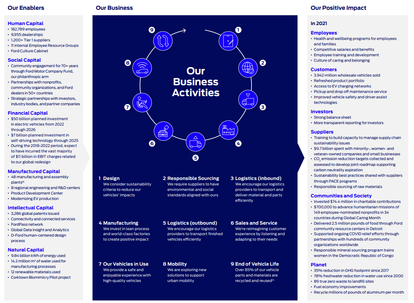
Fig 1: Ford Integrated Sustainability and Financial Report 2021
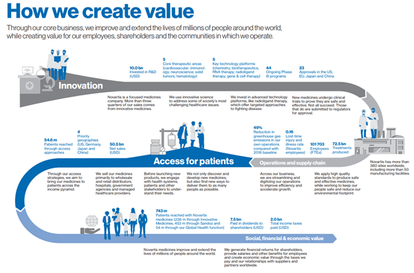
Fig 2: Novartis in Society Integrated Report 2022
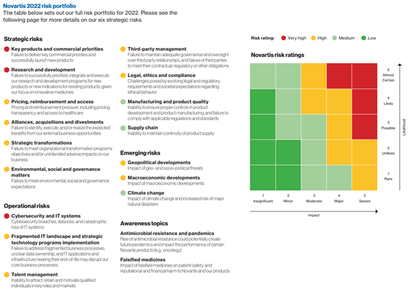
Fig 3: Novartis in Society Integrated Report 2022
Transforming portfolios – Danone, Anglo American and Holcim
Companies love to talk about innovation and transformation, but few paint an effective picture for investors and other stakeholders of how they are transforming and growing their business to respond to global trends. Danone presents a set of extra-financial performance figures alongside its key financials (Fig 4), with its “company dashboard” providing greater insight into the pace and direction of this transformation (Fig 5). Meanwhile, mining company Anglo American illustrates its shift away from thermal coal and toward “future-enabling” minerals (Fig 6), while cement-maker Holcim shows how it plans to grow its green portfolio and “solutions and products” business, with green roofing systems and cooling technologies (Fig 7).
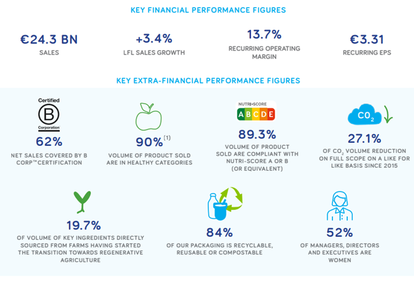
Fig 4: Danone Integrated Annual Report 2021
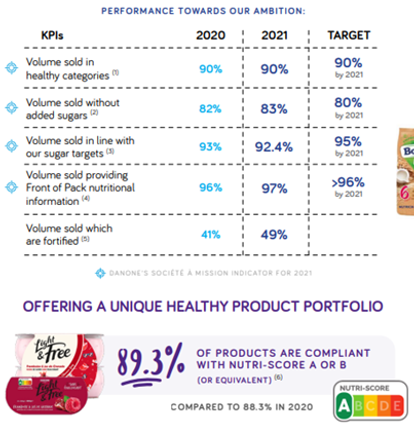
Fig 5: Danone 2021 Company Dashboard
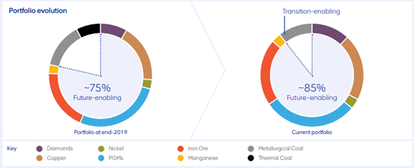
Fig 6: Anglo American Integrated Annual Report 2021


Fi. 7: Holcim Climate Report 2022
Transition planning – P&G and Unilever
Despite a surge in corporate net-zero commitments, fewer than 1% of companies have credible low-carbon transition plans, according to CDP. Best practices are still emerging – few companies back up engaging visuals with informative content, and many get hazy on the details past 2030. P&G bucks the trend with a compelling visual (Fig 8), showing how the company plans to meet its 2040 net-zero ambition across operations and supply chain (even if the “natural or technical solutions” relied on to remove residual emissions remain vague). Meanwhile, Unilever assembles an array of initiatives that add up to its overall plan (Fig 9).
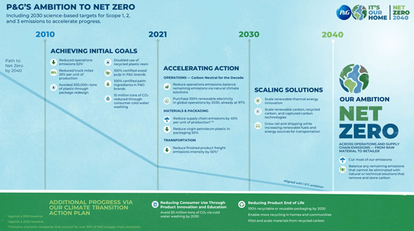
Fi. 8: P&G Climate Transition Action Plan
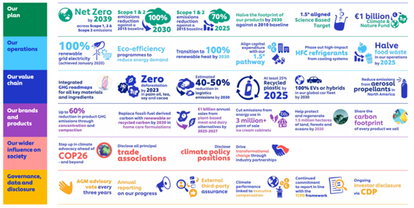
Fig 9: Unilever Climate Transition Action Plan
Double, double toil and trouble – Enel and CLP
The concept of double materiality, as discussed in our accompanying article, functions as a lens through which to focus reporting on a company’s greatest social and environmental impacts, alongside their most pressing financial risks and opportunities. European standards drawing on the concept are not yet finalised, and few companies effectively leverage it in their reporting (despite the many ESG service providers claiming to offer companies an off-the-shelf solution).
The newness of the idea doesn’t help. Enel devotes multiple pages to explaining unfamiliar concepts, before arriving at a relatively clear summary of the issues it considers material from financial and impact materiality perspectives (Fig 10). Not all experiments are successful – for example, CLP’s confusing “materiality matrix” (Fig 11) gives no indication of size, severity or likelihood of the identified topics – but all are interesting.
While we understand the impulse to create a flashy new matrix, this shouldn’t be the focus. Instead, “double materiality” should mean a clearer link between ESG issues and broader business risk management processes (as in the Novartis example above), combined with a more in-depth understanding of their actual and potential impacts on people and the environment. What could be simpler?
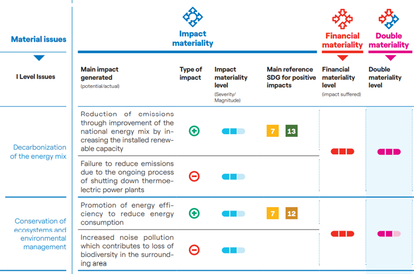
Fig 10: Enel Materiality Analysis Process
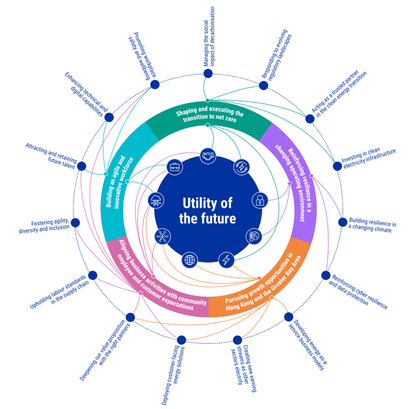
Fig 11: CLP Materiality Assessment
Have we missed any examples of reporting best practices? Contact us.
Recent posts
-

-

-

Transforming the Food & Beverage industry: From compliance only to business-driven decarbonisation
by Vincenzo Giordano, Joseph Payne, Stéphane Rapoport
View post